Differential calculus is probably the greatest mathematical tool ever created for physics. It enabled Newton to develop his famous laws of dynamics in one of the greatest science book of all time, the Philosophiae Naturalis Principia Mathematica. Since then, differential calculus has had countless of other applications, like, for instance, in biodiversity, economics or optimization. It is hard to stress how essential it has become.
I usually write about grad school mathematics, but I have recently seen the following video about high school mathematics in the UK:
I have learned differential calculus in high school in France. Yet, as far as I can remember, I only truly made sense of it years later. Although this article surely won’t replace your textbooks, I hope it will improve your insight in the mathematics of calculus. This article is what I wish I had read years earlier.
Function
In textbooks, differential calculus is often illustrated by the calculation of speed given variations of position. This is also why it was first invented historically. But if you are rather an economist, you might have been introduced to calculus with the calculation of marginal cost, that is the variation of cost as a function of the amount of production. Let’s see something different in this article!
Let’s consider the following picture I took in the amazing Milford Sound, in New Zealand:

Now, if you open this image with Windows preview application, iPhoto, GIMP or any image software, you’ll be able to modify the contrast of this picture (in image editing, you may find a Luminosity-Contrast option).
Basically, as you increase the contrast, bright areas of the picture will become brighter, while dark areas will become darker. Now, computationally, the contrast is associated with a number. There are plenty of possible scales for the contrast, so I’ll use the one on iPhoto to illustrate what I’m saying. In iPhoto, the contrast is a number between -100 and +100. Let’s see what happens when I modify the contrast:

Now, as I’m manipulating this image, guess what my problem is…
Yes! But the problem with this question is that the concept of “beautiful” is not well defined. In order to do maths, I am going to introduce a measure of beauty. The first thing that would come to Mark Zuckerberg’s mind is probably the number of likes it would get once uploaded on social networks.
Exactly! There will be a number of likes corresponding to each contrast value. What we are defining here is a function which maps contrast values with number of likes.
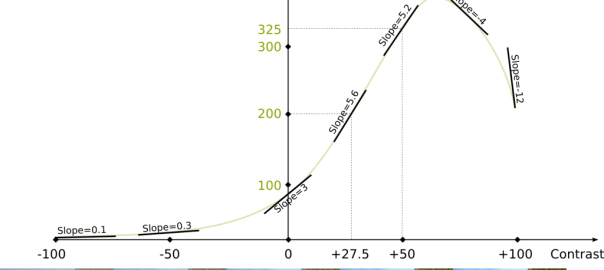
Indeed. But since I’m too lazy to carry out the experiment, I’ll assume this function is given to us! This function is described by the following figure:

Obviously, it’s far from reality… But it’s the assumption we’re going to work with. In this figure you can see that any contrast value is mapped with a number of likes. For instance, if the contrast value is 50, then the number of likes is 325. Meanwhile, if the contrast is 27.5, then the number of likes is 200.
Derivative
Now that we have defined our problem, let’s get to the major concept of this article: differential calculus.
It all starts with the following observation: Let’s zoom in around contrast value 27.5, as done in the following figure.

Look at the most zoomed in picture on the right…
Exactly! This simple remark is the most important remark in calculus!
Yes! With more mathematical words, we say that the function can be locally approximated linearly. It’s the exact same reason why the Earth seems flat to us: It’s because our scale is much much smaller than the scale of the Earth. But as we know, the Earth isn’t flat, which has dramatic consequences, as explained by Scott.
The actual mathematical definition of these terms is relatively complicated as it involves the fundamental concept of limits, which is a topological concept. You can read my article on topology to learn its most fundamental definition.
Here, let’s behave like 17th and 18th century mathematicians like Newton and Leibniz who used these concepts without actual good definition…
It is a big deal!
Because lines are so much simpler than curves! While non-linear optimization is very difficult, linear programming can be done extremely quickly!
That’s the spirit! Now, one thing we already know about this line is that the number of likes equals 200 when the contrast value is 27.5. This defines a point through which the line must go. But this is not enough to describe the line. We need one more information. This information is the slope of the linear approximation.
The slope is more or less the direction of the line. The higher the slope, the more vertical the line. The slope can also be negative, in which case the line is going down. This is displayed by the following figure:

Exactly!
Let’s better define the slope! In our case, the slope is the variation of the number of likes for the linear approximation relatively to a variation of the contrast value. More generally and more precisely, the slope is the ratio of the variation of the value of linear approximation of the function by the variation of the argument of the function.
Sure! Let’s look at the linear approximation we have obtained after having zoomed in.

Now, to compute the slope, we have to consider a variation of contrast value. For instance, let’s consider a variation of +0.5. This means that we are going to compare the reference contrast value 27.5 with the deviated contrast value 27.5+0.5 = 28. Now, to obtain the slope we need to estimate how this affects the number of likes. The reference number of likes is the number of likes corresponding to the reference contrast value 27.5, and as we have seen earlier, it is 200. Now the deviated number of likes is the one corresponding to the deviated contrast value 28. It is 202.8. This means that there has been a variation of number of likes equal to 202.8-200 = +2.8.
Overall, a variation of contrast value of +0.5 has induced a variation of number of likes of +2.8. The slope is the ratio of the effect of the variation by the variation. Thus, the slope of the linear approximation is 2.8/0.5 = 5.6.
This is an excellent question! In fact, I strongly recommend you to question the meaning of any number you ever find. A bad interpretation of numbers is extremely misleading.
In our case, to obtain this number, we have divided a variation of number of likes by a variation of contrast value. So the unit of this number is a number of likes per contrast value. The slope is 5.6 likes per contrast value. It means that if we vary the contrast value by 1, then the number of likes will increase by 5.6.
Not if you’re computing the slope of a line! Thus the slope of the linear approximation does not depend on the variation we choose.
Yes we can. The slope of the linear approximation of a function is called the derivative of the function. But it’s important to notice that the derivative depends on the contrast value where we compute it, because the linear approximation depends on this contrast value. The following figure shows linear approximations for different contrast values:

Note that the linear approximation could be a vertical line, in which case there would be no real slope to describe it. We would say that the derivative isn’t defined for such point.
This sounds like a function, doesn’t it? The derivative is actually the function that maps contrast values with slopes of the linear approximations. And we can draw this function, just like we drew our original function. In fact, one usual and nice way to do this is to draw the function on the same graph, but with a different vertical scale. Indeed, for instance, the unit must correspond to the unit of the derivative, as displayed in blue in the following figure:

Some of the value of the derivatives already appeared in the previous figure, and we just need to fill the gaps! But basically, the higher the slope of the linear approximation, the higher the derivative.
Now, if your function has an explicit form, like f(x)=x2 ln x, then there are formulas to obtain an explicit form of the derivative. But I won’t focus on these formulas in this article. If you can, please write an article about how to evaluate explicit forms of derivatives.
Major Properties
As we have seen, the derivative is the slope of the linear approximation. And this slope tells us a big deal about the local monotonicity of the function.
The monotonicity is whether the function is increasing, that is, whether increasing contrast will increase the number of likes. As you can see in the previous figures, if the slope of the linear approximation is positive, then this means that the function is increasing indeed.
This gives us the first major theorem about derivatives: the function is locally increasing if and only if its derivative is positive. Similarly, the function is locally decreasing if and only if its derivative is negative.
Hehe! That’s more complicated. In fact, every case is possible as displayed in the following figures:

Since people are often mistaken about nil derivatives, I’m going to write it in bold letters. If the derivative is nil, there’s not much we can say.
The knowledge that the derivative is nil is useless. Now, an interesting consequence of the first major theorem we stated is the following. If a point is a maximum or a minimum, then its derivative can neither be positive nor negative: the derivative is therefore nil. This is the second major theorem you should know.
As a result, if you’re searching for the maximum of number of likes, you don’t need to test all the contrast values. You can restrict the search to the contrast values for which the derivative is nil. And most of the time, the number of values for which the derivative is nil is very small, so this leads you to a small number of tests.
Exactly! Now, you can even better reduce the number of values to compare (possibly to one unique value), if you study the convexity of your function as well. But I’m not going to get into this right now. But if you can, you should write an article about convexity, which is a crucial concept in optimization.
Now, the second major theorem we mentioned has a consequence, called Rolle’s theorem. This is a major theorem in calculus.
Before stating Rolle’s theorem, I want to stress something. The derivative of a function is only defined if there actually exists a linear approximation. This is not always the case. If the derivative is always defined, the function is called differentiable. That’s how nice classical functions are. But, for instance, the following function is not differentiable in 0, as there is no linear approximation at this point:

Now, Rolle’s theorem says that if a function is differentiable between two extremity points, and if the values of the function at these two extremities are the same, then there exists a point between the two extremities which has a nil derivative.
One of these three cases is necessarily true (the first two may be both true).

In any case, there is a maximum or a minimum between the extremities. According to the second major theorem, the derivative of this point is zero. This proof was given in 1691 by Michel Rolle.
Well, not yet. Newton was still alive in 1691… Now, the fourth and last theorem I want to present in this article will make you more knowledgeable than the English genius! It’s the mean value theorem, proven by Augustin Louis Cauchy in the 19th century, and proudly written on this bridge in Beijing:

Let’s consider two extremities once again, but without the assumption that they have the same values of the function. Now, we can consider the line which maps the function at the two extremities. This line is sort of a (very bad) approximation of the function between the two extremities, but its slope does describe how the function varies overall between the two extremities. Let’s call this slope, the overall slope of the function between the two extremities.
The mean value theorem says that, if the function is differentiable between the two extremities, then there exists a derivative between the extremities which is equal to the overall slope.
This is illustrated in the following figure:

Just rotate the image so that the two extremities have the same value of the function! Let’s see what this yields:

Indeed! We can apply Rolle’s theorem, which says that there is now a point between the extremities with a nil derivative. If we rotate back the figure, since we rotate all linear approximations with the same angles, then we see that the derivative of this point is actually equal to the overall slope.
The actual proof consists in writing mathematically what we have done visually. This can be done by noticing that adding a linear term to a function is almost equivalent to rotating the figure. More precisely, it corresponds to a vertical contraction of the figure (I talk about contraction according to an axis in my article on symmetries). Based on this remark, I count on you to write the proof yourself!
Let’s Conclude
I have introduced the derivative as the slope of the linear approximation, while you have probably learned about the limits of the difference quotients. But the concept of limits is very complicated (I have seen professors of mathematics actually make fundamental mistakes about this concept!), and I don’t want to introduce it without really explaining it. What I mean is that limits have to be treated with caution. Also, although in our simple cases, it doesn’t make much of a difference, in higher dimensions, understanding the derivative through the linear approximation is much more relevant.
The History of calculus is quite amusing, as it turned into a matter of national pride:
Th ideas of both scholars Newton and Leibniz were fantastic, but it’s interesting to notice that they were also not rigorous. In fact, it wasn’t until Cauchy in the early 1800s that the concept of derivative finally had a good definition! I think this must teach us humility. If even Isaac Newton couldn’t get his reasoning totally right, how can we claim that our reasonings are perfectly straight, unless based on extremely solid deductive proofs (which only exist in mathematics that only few understand)?
In fact, most of the time, we subconsciously consider something understood when it is not. One of the most striking example that comes to my mind regards the concept of acceleration. The derivative of the position is speed, and it is something we are relatively familiar with. But acceleration corresponds to the variation of speed. It’s therefore very different from speed! And we often make mistakes regarding it. For instance, keep in mind that the Moon is always accelerating towards the Earth, but never moving towards the Earth. I hope this can avoid your misconceptions. I really like the following video by Derek Muller on Veritasium about misconceptions:
Leave a Reply